


Keratograph® 5M
Topograph
High-precision measurements of the cornea’s true curvature — designed for advanced medical and ophthalmic equipment applications. The device provides accurate data for perfect contact lens fitting and customization. An intuitive, user-friendly interface combined with high-resolution imaging ensures clear and reliable results for every patient. An ideal solution for clinics seeking professional ophthalmic devices and high-quality medical equipment.
Keratograph® 5M
OCULUS
The OCULUS Keratograph® 5M is a state-of-the-art corneal topographer that combines precise measurement technology with high-resolution imaging capabilities. It enables comprehensive evaluation of the cornea’s true curvature and tear film quality, providing a complete picture of the ocular surface condition. The device delivers detailed insights into meibomian gland function, non-invasive tear film break-up time, and tear meniscus height. In addition, the Keratograph® 5M assesses the structure and stability of the lipid layer, which is essential for diagnosing and managing dry eye syndrome. With its intuitive interface and user-friendly operation, ophthalmologists can obtain high-definition images and accurate results quickly and efficiently. These features make the Keratograph® 5M an indispensable tool for modern eye care professionals committed to precision, excellence, and personalized patient care.

Detailed information
Crystal TEAR Report
Benefit from all the advantages of the Crystal TEAR Report in the Keratograph® 5M: efficient screening, well-founded measurement results, and greater patient loyalty. With its preselection of recommendations and the option to manually adapt them, the Crystal TEAR Report allows you to draw up an effective treatment, according to the individual causes of dry eye, in the shortest time. The result: a comprehensive dry eye analysis.
Complete Documentation
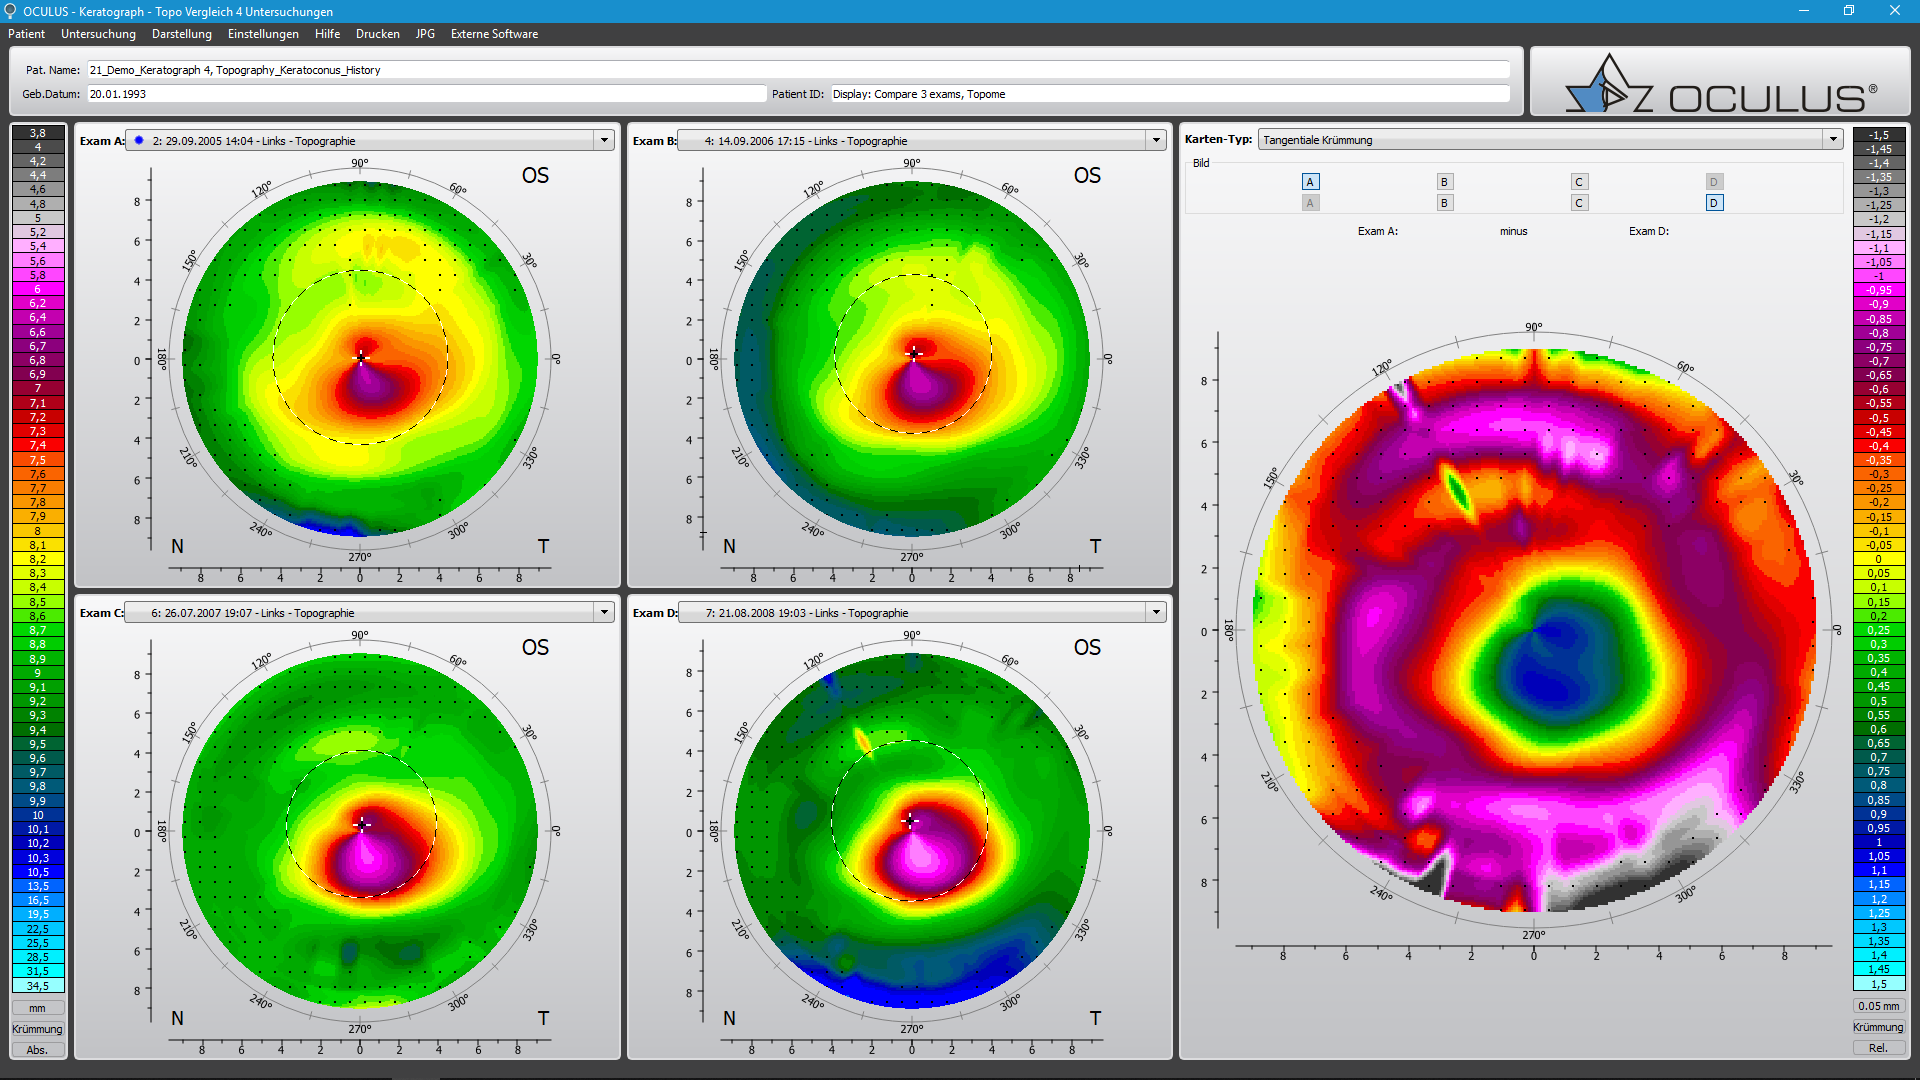
Follow-ups require comparison of several examinations. In doing so, changes can be easily detected and fully documented. Regular follow-up examinations provide reliability and increase the trusting relationship between you and your patient. The Keratograph® software contains both data and image documentation.
Contact Lens Fitting
An ideal lens is chosen from the large lens database and is then suggested in the Lens Fitting display. Based on this topographic data, a simulated fluorescein image of this particular lens is created. You can then take real fluorescein images with the Keratograph® 5M and compare them with the simulated images.
Gain Trust
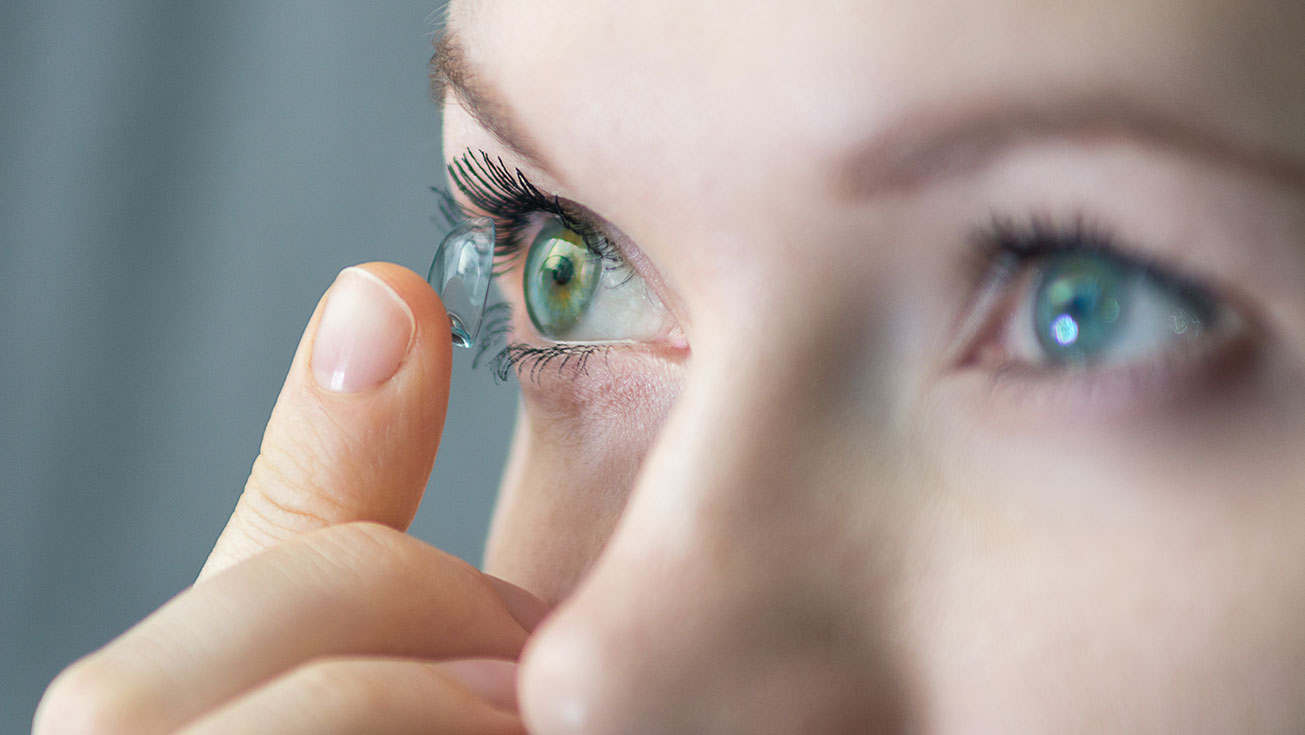
With the Keratograph® 5M, you can show your patients images they have never seen before. Gain patient trust by providing professional consultation during examinations and follow-ups.
Easy-to-Understand Presentation
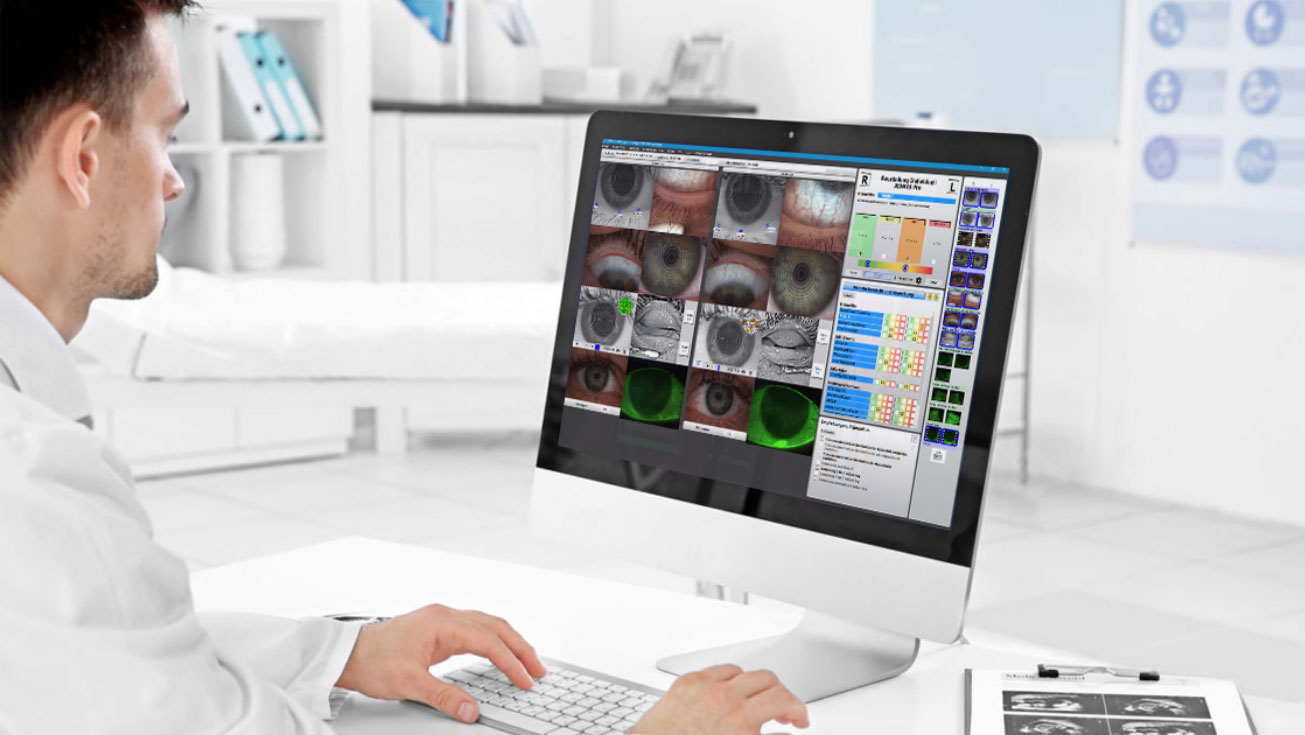
Actively integrate the Keratograph® 5M into your consultation. Many easy to understand displays support you in communication and patient education. Use your Keratograph® 5M as a marketing tool to make your services transparent!
Capture High-Quality Images & Video Sequences Easily and Efficiently
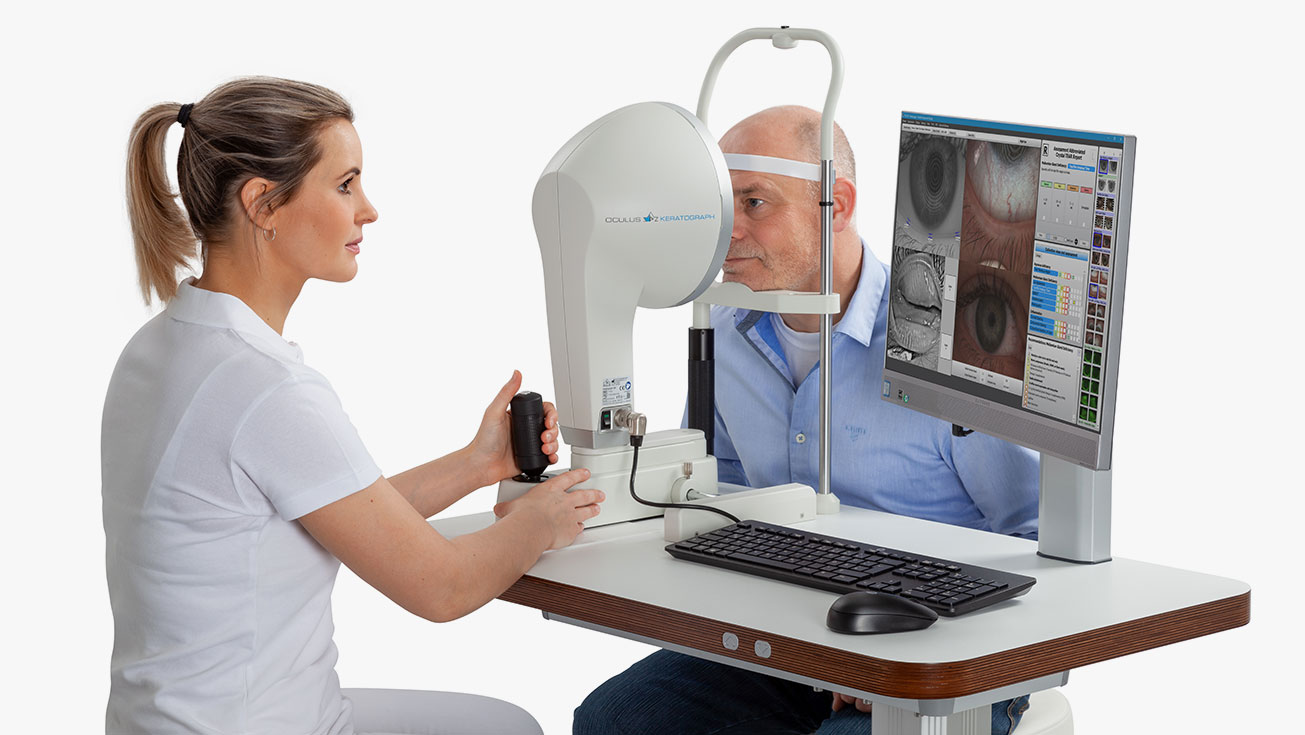
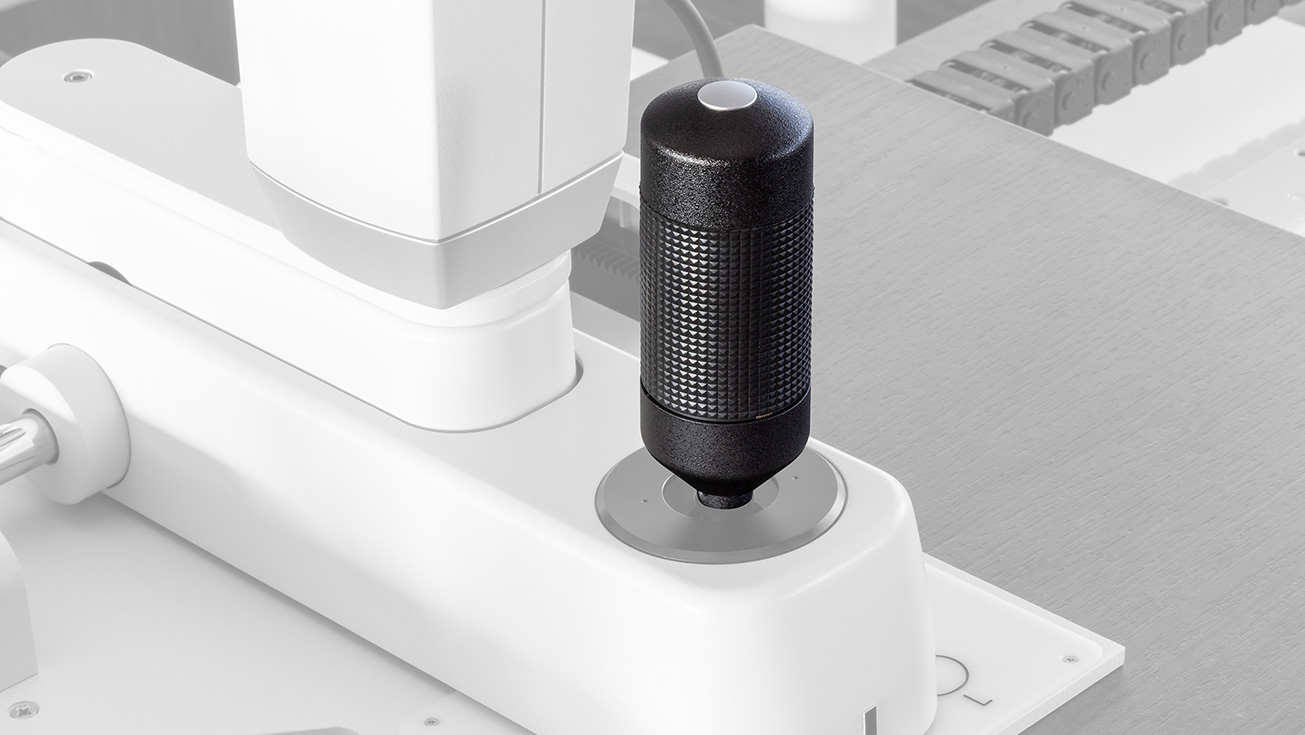
The Keratograph® 5M joystick allows you to capture images and video sequences directly from the device via a smart Bluetooth interface. No need to use the mouse: your hand just stays on the joystick, making it much faster and easier to capture images or videos. In addition, the joystick does away with the need for cumbersome power cabling. The joystick also switches to sleep mode function when not in use to extend battery life.
Software
TF-Scan
Makes the Tear Film Visible
The tear film is assessed using either white or infrared illumination. The new high-resolution color camera makes even the finest of structures visible. In addition to NIKBUT (Non-Invasive Keratograph® Break-Up Time) and measurement of the meniscus tear, the TF-Scan can also assess the lipid layer and the tear film dynamics. Tear film analysis with the OCULUS Keratograph® 5M is non-invasive and is conducted without any additional tools.
NIKBUT – Assessment of the Tear Film Break-Up Time
The tear film break-up time is measured non-invasively and fully automatically. The new infrared illumination is not visible to the human eye. This prevents glare during the examination. The TF-scan presents the results in a way that is easy for you and your customers to understand.
Meniscus Tear Height – Assessment of the Tear Film Quantity
The height of the tear meniscus can be precisely measured with an integrated ruler and various magnification options, and its development along the edge of the bottom lid can be assessed. The results are saved to the patient file.
Lipid Layer – Assessment of the Interference Phenomenon
The interference colors of the lipid layer and their structure are made visible and can be recorded. The thickness of the lipid layer is assessed based on the structure and color.
TF Dynamics – Assessment of the Particle Flow
The video recording, with up to 32 frames per second, enables the observation of the tear film particle flow, from which conclusions regarding the viscosity of the tear film can be drawn.
R-Scan – Assessment of the Particle Flow.
Automatic classification of the bulbar redness. Conjunctival redness used to be assessed subjectively and depended on the examiner. The R-Scan is the first module that automatically and objectively documents and classifies the degree of redness in the bulbar and limbal areas. The R-Scan detects the blood vessels in the conjunctiva and evaluates the degree of redness. This automatic assessment spares you the time and effort of having to make manual comparisons using classification sheets.
Meibo-Scan – Meibography of the Top and Bottom Eyelid
The multi-functionality of the Keratograph® 5M easily and efficiently integrates difficult examinations such as meibography. The dysfunction of meibomian glands is the most frequent cause of dry eye. Morphological changes in the gland tissue are made visible using the Meibo-Scan and can be classified with the JENVIS Meibo Grading Scales.
Crystal TEAR Report
Make Dry Eye Diagnosis Crystal Clear
Find out the cause of dry eye disease quickly and reliably with the assistance of the new Crystal TEAR Report in the Keratograph® 5M. Carry out a comprehensive analysis using the measurement results as a basis for your diagnosis. All results are summarized in a patient-friendly, neatly arranged printout, enabling you to combine documentation and patient education.
Recording Made Easy
Up to 50 recordings can be carried out easily for documentation purposes. Readily understandable user tips and optimal auto-setting before each recording make it possible to delegate the entire measurement process. Despite the high degree of user guidance, you can directly delete faulty recordings as well as change settings and adapt the measurement sequence individually.
Excel With Your Dry Eye Diagnosis
The entire course of diagnosis is documented, providing you with an ideal basis for your treatment decisions. All necessary recordings that are required to grade the individual's dry eye state can be viewed at the same time. Depending on the grade you obtain, you can then determine a suitable treatment plan. Additionally, you can enter the data from other tests, such as Osmolarity, Schirmer's Test, Phenol Red Thread Test, and more.
Documentation and Patient Education
The Crystal TEAR Report surely and safely walks you through all the necessary assessment criteria that make up a comprehensive dry eye analysis. To complete the treatment plan, you can manually enter your dosage recommendations for the individual therapeutic measures on the printout. Making it an easy-to-grasp, optimal means of patient education.
Imaging Software
Indispensable for:
- Demonstrating the fit of contact lenses
- Assessment of the static fluo-image
- Assessment of the fit of contact lenses at different pupil sizes
- Comparison of fluo-image simulations with real-time fluo-images
- Selection of the best possible contact lens
- Consultation and customer retention
OCULUS OxiMap®
Oxygen Transmissibility of Soft Contact Lenses Made Visible
The OxiMap® presents a color map of the oxygen transmissibility of soft contact lenses based on the lens power, which is easy to understand, even for your customers! An intact tear film and a good supply of oxygen to the cornea are an absolute necessity for wearing contact lenses comfortably. The OxiMap® presents a color map of the oxygen transmissibility of soft contact lenses based on the lens power, which even your customers will understand!
Easy-to-Understand Patient Education
The oxygen transmissibility (Dk/t) depends on the material the contact lens is made of and on its thickness. In the past, only the manufacturers’ specifications about the oxygen transmissibility in the center of a -3.00 dpt contact lens were available. With the OxiMap®, you now get a graphic visualization of the Dk/t values over the whole area, based on the lens thickness. The Dk/t values are color-coded, whereby black represents an oxygen supply lower than that present in a closed eye. To preserve the integrity of the cornea when wearing contact lenses, minimum Dk/t values are recommended based on the length of time the contact lenses are to be worn. The OxiMap® color-coding is based on these international recommendations.
Compare Different Soft Contact Lenses!
The OxiMap® is individually adapted based on the lens power and supports you in your consultation with the patient, and helps you to choose the most suitable contact lens. New materials used for soft contact lenses provide excellent oxygen transmissibility. OxiMap® was developed in close cooperation with JENVIS Research and the University of Applied Sciences in Jena.
Pupillometry
Indispensable for:
- Fitting multi-focal contact lenses
- Exact determination of the treatment area for refractive surgery
- Seamless integration into the existing Keratograph® software
- The infrared camera installed in the Keratograph delivers images of the patient’s pupil, which are used as the basis for the measurements
Different Ways of Determining Pupil Reaction:
- Examination of the pupil reaction both with and without glare
- Examination using two different glare stimulus powers
- Clear presentation of the results in graphic form: pupil changes over some time; minimum, maximum, and mean pupil diameter, incl. standard deviation
- Comparison views possible


